


NASA’s OPERA project brings together multiple space missions to track water and land changes. Merging data from multiple satellites, it can help government agencies, disaster responders, and the public access data about natural and human impacts to the land.
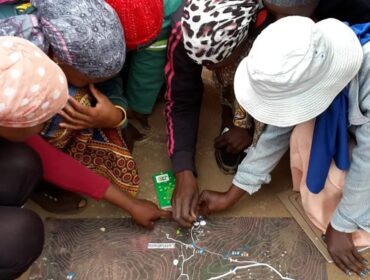
WD News: Scientists routinely rely on data-intensive analysis and visualisation of satellite observations to track Earth’s ever-changing surface. A new project will make it possible for anyone with an internet connection to begin to answer the changes to our dynamic planet.
The Observational Products for End-Users from Remote Sensing Analysis (OPERA) project is managed by NASA’s Jet Propulsion Laboratory, with partners from NASA’s Goddard Space Flight Centre, the U.S. Geological Survey (USGS), the University of Maryland, the University of Alaska Fairbanks, and Southern Methodist University. Scientists conceived OPERA in 2020 to address satellite data needs across different federal agencies and to enable better access to information on everything from water management to wildfire monitoring. The first offerings will be available in April 2023, with more to follow.
OPERA is aggregating a unique combination of user-friendly data about Earth’s dynamic surface water and land, noted John Jones, a USGS scientist and OPERA project partner.
Mapping Surface Water
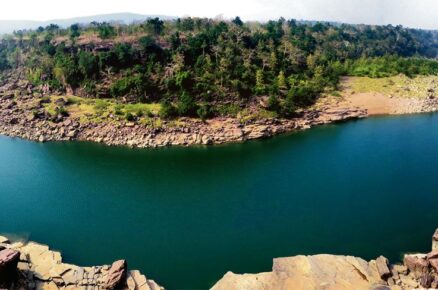
OPERA’s Dynamic Surface Water Extent product suite offers what may be the most comprehensive data source for monitoring lakes, rivers, reservoirs, and streams. The first phase relies on Harmonised Landsat Sentinel-2 (HLS) optical data to generate near-global surface water mapping every few days at a 30-meter spatial resolution. Subsequent phases will use Sentinel-1, SWOT, and NISAR radar observations to map surface water more often (because radar can penetrate cloud cover).
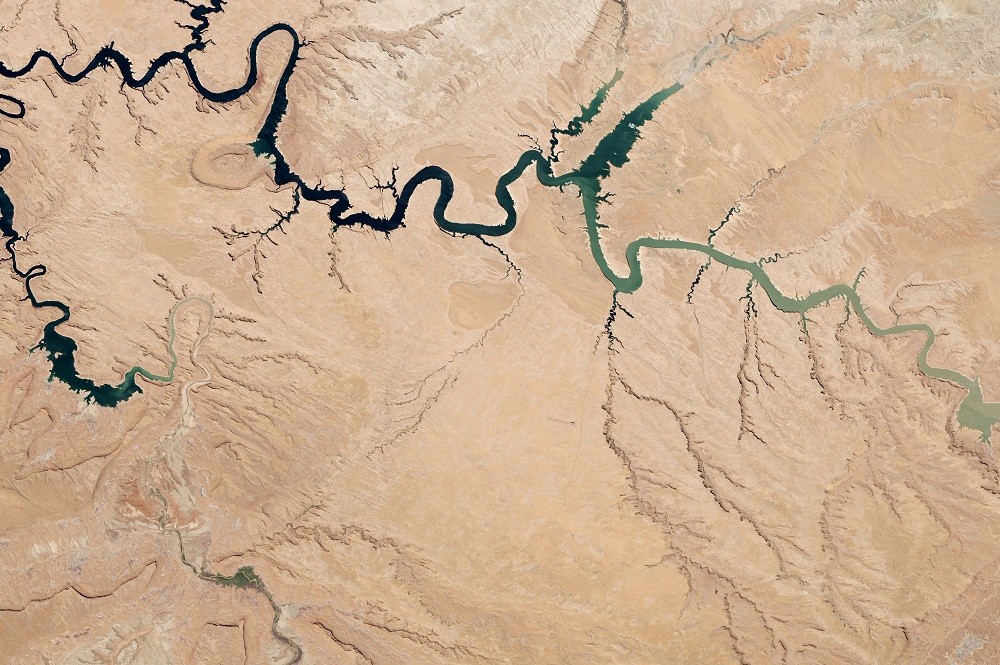
For example, when a series of nine atmospheric river events brought heavy rain and snow to California in the winter of 2022-23, several flood-control dams faced risks of overflowing. OPERA’s surface water maps chronicled the dramatic filling of these reservoirs.
Source & image courtesy: NASA/ NASA Earth Observatory image by Robert Simmon using Landsat data from USGS